I’ve noticed that successful Traders have a slightly different view of trading and what success means; how they measure their results and how they measure their trading systems and evaluate the results of trading. So, I’m going to show you my personal view that I have not seen anywhere in the Forex realm but it comes from my training as a chartered accountant and also from my training as an investor, where I try to squeeze out the best returns with the least amount of money so that my return on money is maximised. Now, I’ll give you an example before we delve into this, is that for instance when you double your account, let’s say you start with like ten thousand dollar account. You double it to twenty thousand dollars; there are various options open to you, but the one option is to withdraw ten thousand dollars because what you then do is you take that ten thousand and put it back in the bank where it is safe. You restart your trading with the original Ten Thousand which is by the way the gains that you’ve made. What this does is it turns your trading into risk-free trading because you are no longer using your money as you are using the broker’s money. Therefore you have a return on zero Capital so you are actually “printing” money. now the concept I’m going to show you is very similar to that so that you are trading with no risk or very low risk. I’m going to show you examples of no risk and very low risk so that you are using an effective trading strategy and going to show you how to evaluate an effective strategy.
I’m going to go through it very simply and explain my philosophy towards trading and a trading account that trades over a year. when you start trading, and I’m going to start with the assumption your income is zero, but as you make your first trade, your potential risk for maximum drawdown level suddenly jumps into place. I’m talking more specifically about robot trading but this also applies to manual trading, so after your first trade you are exposing yourself to a possible drawdown during the trading of your account, of let’s say three thousand dollars, so that’s that amount that represents your maximum drawdown. it is on the dollar side of the graph. Let’s say you are starting with zero, so what then happens is that over time you start making profits and the profits start reaching the point where your maximum drawdown level is, so during that period you are in a high risk Zone because you are actually you haven’t made enough profits to cover your potential drawdown level but then it reaches a point where the income line goes above the maximum drawdown line and there is the maximum take profit. From then on your risk reduces tremendously because you are almost trading risk free because you’ve already earned enough profits to cover potential losses from drawdowns so that part is sorted out. the rest of your trading has what I call no risk or low risk and that is the Zone the green zone the whole green area here is the “printing” of money Zone because what I’m saying is I’ve paid for my drawdown I don’t have to worry about that and in all the money I’m making is with no risk or very low risk and this will become clearer as we go through a few examples but that’s the concept here.
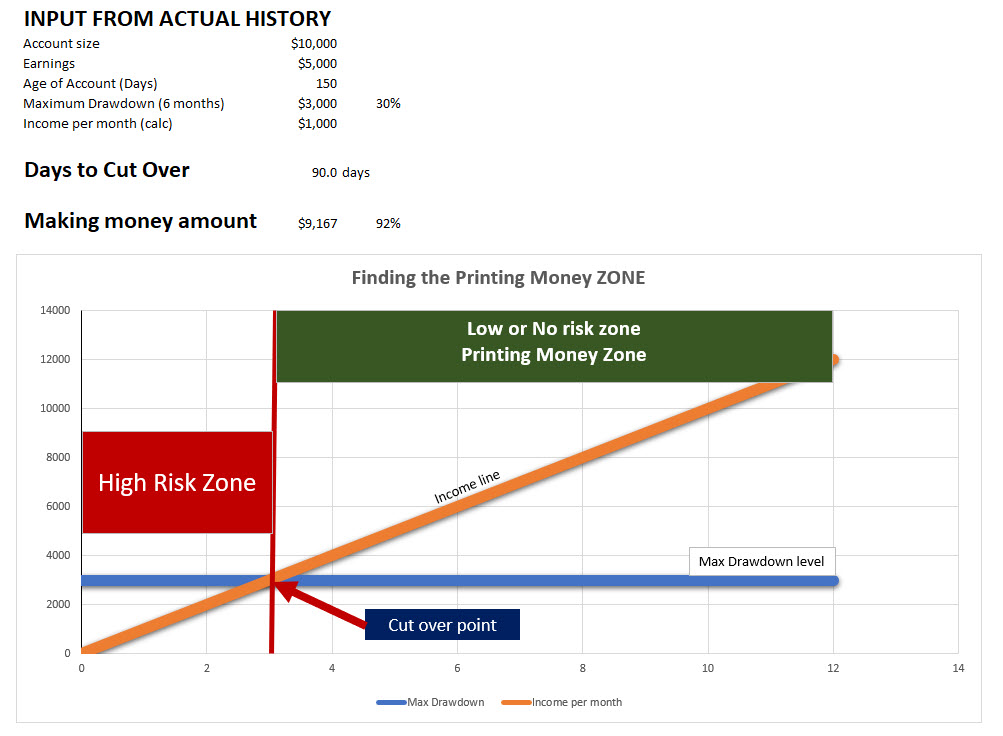
What I see recently is that a lot of people like using Equity Management. in other words if their drawdowns reach a certain level they close all their deals and they start again so what really happens when that happens is they just go back into this high risk Zone and they might not even start at zero they might even start at minus something because they’ve closed all their deals at a loss and I see these bad habits happening in the market. it’s clear that they don’t understand this principle of generating an income line that will cross over your drawdown line so that you can’t go back into this high risk zone or that you must trade yourself out of that one. I’ll show you it’s quite easy to do this and in this example shown in spreadsheet picture as Example 1 below for instance there’s an account size of 10 000 that we’re starting with and the historical record of this particular account says that the earnings to date on this account is five thousand dollars but it’s only been trading for 150 days which is five months so the income per month is therefore five thousand divided by five which is a thousand dollars so this line goes up by a thousand dollars every month. So, the account starts at zero up a thousand two thousand three thousand four thousand and so on that’s where that line comes from at the maximum drawdown and you need to look at the maximum drawdown over the last six months which is three thousand dollars so that’s where that number comes from that’s why that line is drawn at the three thousand dollar line and then I’ve done calculations which says how long will those earnings take to reach the cut over point. on the chart it will take three months or 90 days and then after that for the rest of the year how much money will you be making if you take the money that’s made from that point to that point – it is nine thousand dollars and it gives you a return of 92% on your money over a 12-month period so that’s the way I look at accounts. I look at the history of the account and I analyze the accounts and ask what is the potential of this account in terms of making money and return on investment.
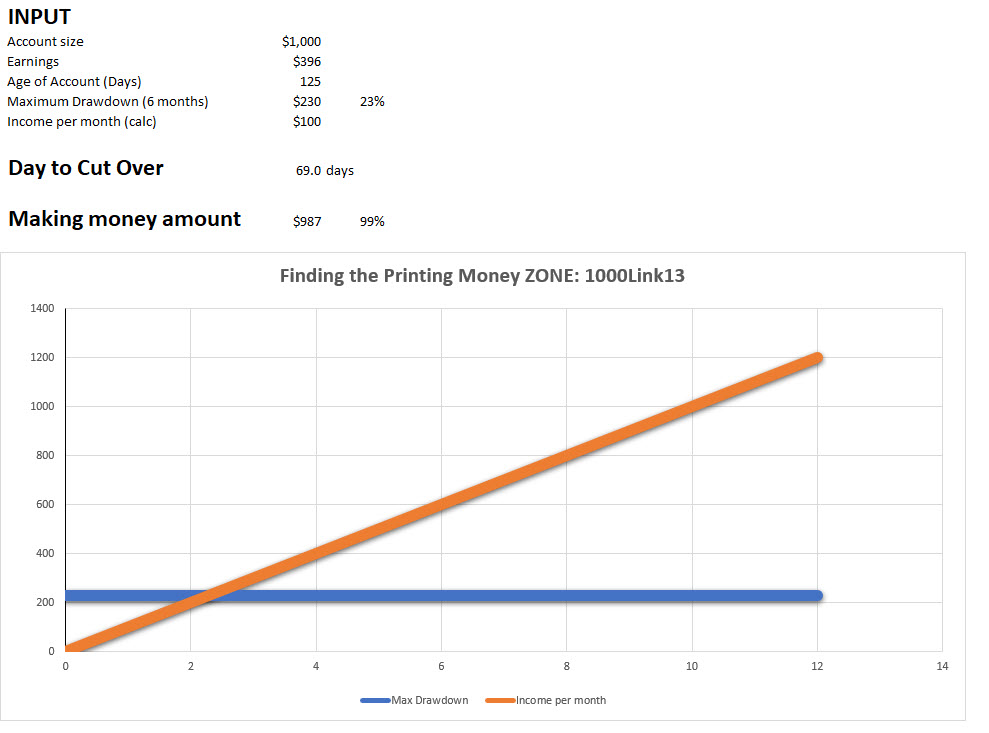
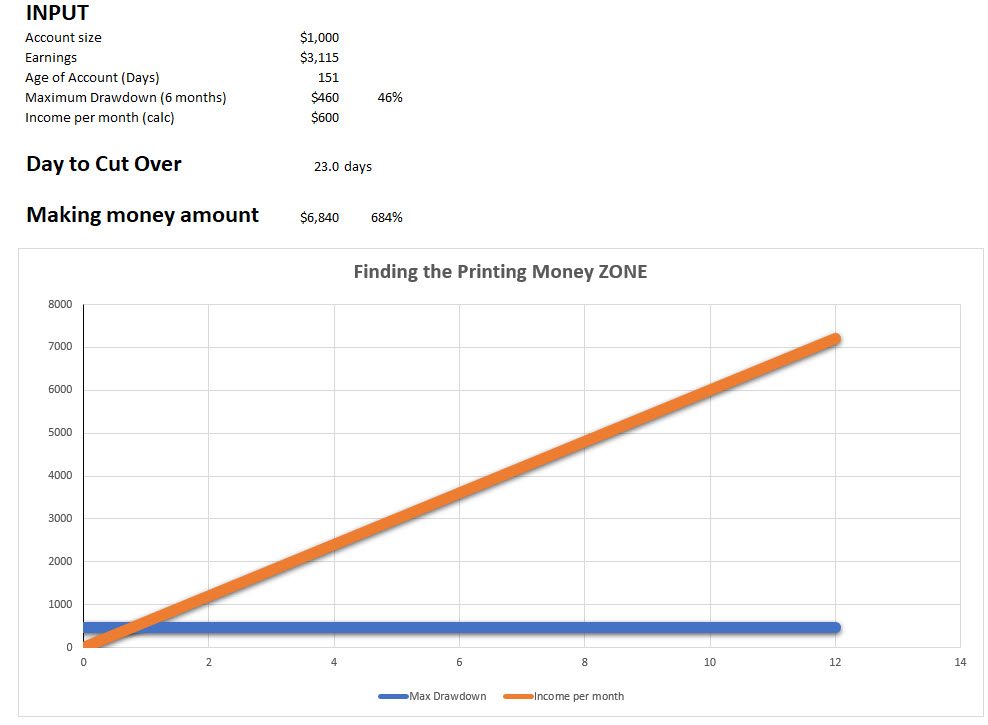
So, that’s the concepts that I want to go through today I hope you understand those Concepts that might be quite confusing for somebody who is not used to using graphs or analysing results and things like that but those are the concepts I use when I say I’m in a high risk Zone when I open a new account until I have paid for the maximum drawdown and after that I am making money that’s the basic concept. I’m going to take an account from the linking service the 1000link13 account as shown in labelled spreadsheet picture below and it trades an account size of a thousand dollars it has made earnings of just under 400 in the last just over four months so it’s 125 days so the income per month is roughly a hundred dollars but and the maximum drawdown and I’m going to show you how where we find that over the over the last six months has been 230 dollars. we know the drawdown and it is 23% of the capital where the drawdown was and the cut over will happen in 67- 69 days which is just after two months around about there. Some of these calculations that are programmed and the calculations show that from this point to the end of the year its possibly up by 987 dollars which is an a return of 99% so that’s a very nice return. this part is as I mentioned what I regard as low risk or no risk and the part where you make money because you are out of the high risk situation where your income hasn’t covered your potential drawdown. Let’s have a look at where these figures come from and here on the link to success web page and I’m in the linkable accounts and looking at 1000link13 you can see it trades a thousand dollar accounted trading the prop cruncher and you can use FX blue analysis and you can see the gain has been 399 dollars and it has been going for about 126 days ; this information changes because this is live and Dynamic. The information I get from FXBlue is the account size, the earnings to date, the days that it’s being traded and the only item we don’t have is the maximum drawdown. now this is a tricky one because FX blue does not show this so you’ve got to go and find it. I go into stats then I go into charts, and then I go into floating profit and loss cash hourly, so that what they’re basically saying is what is the drawdown on an hourly basis on this account. Very important this particular piece of information, so I click on it it shows the biggest drawdown in the last six weeks and we can actually take that which is 230 . Then I do my analysis by calculating all of these ratios. now those ratios mean nothing unless you compare them with other accounts so what I’m going to do is I’m going to just go and look at some other accounts so that we can start comparing these ratios. The I look at which strategy is the best, which strategies are producing the best results how much money can I print and how long do I have to wait to make money so we know we’ve got to wait 69 days here. so let’s go and have a in a little bit more detail and you can see there’s the account size the earnings and all that for 1000link13 and to compare all those statistics in the thousand dollar Series let’s look at another account 1000link4 statistic. 1000Link4 has earnings already of three thousand dollars after 150 days which means that it’s making 600 every month so we start there and after one month it’s 600 and after two months it’s made 1200 and so on and there so that’s where the maximum drawdown line comes from.
Now you’ve seen where I find that and you just go back to the linking service you click on a particular link that we’re analysing 1000link4 of the Thousand series and you’ll see that the maximum drawdown in the last six months was 460 which is a lot – a big percentage of the original capital so it’s a it’s actually had a 46% drawdown but the beauty of this one it only takes 23 days to get to that cut over position where your earnings have covered your potential drawdown and now you’ve got a huge area where you can potentially make money – about six thousand eight hundred on a thousand dollar account which is a return of 684 percent on a risk-free basis because you’ve paid for your potential drawdowns already after 23 days. now I hope all of this is starting to make sense to you
To clarify these Concepts I doing this because firstly it’s telling me that this link is by far more profitable than the 1000link13 so there’s two ways of taking advantage. you can either link to this particular or these two particular links in the linking service or you can find out what the settings are for these ones and trade them yourself. this is a way of evaluating if you were given this information which one would you choose to trade first would you trade 1000link13 first or would you trade 1000link4 and that is why I do this : I would definitely trade 1000link4 first because it has so much you can reach your crossover point so much quicker in 23 days and you can generate so much more income. so we are done looking at two in the thousand dollar accounts.
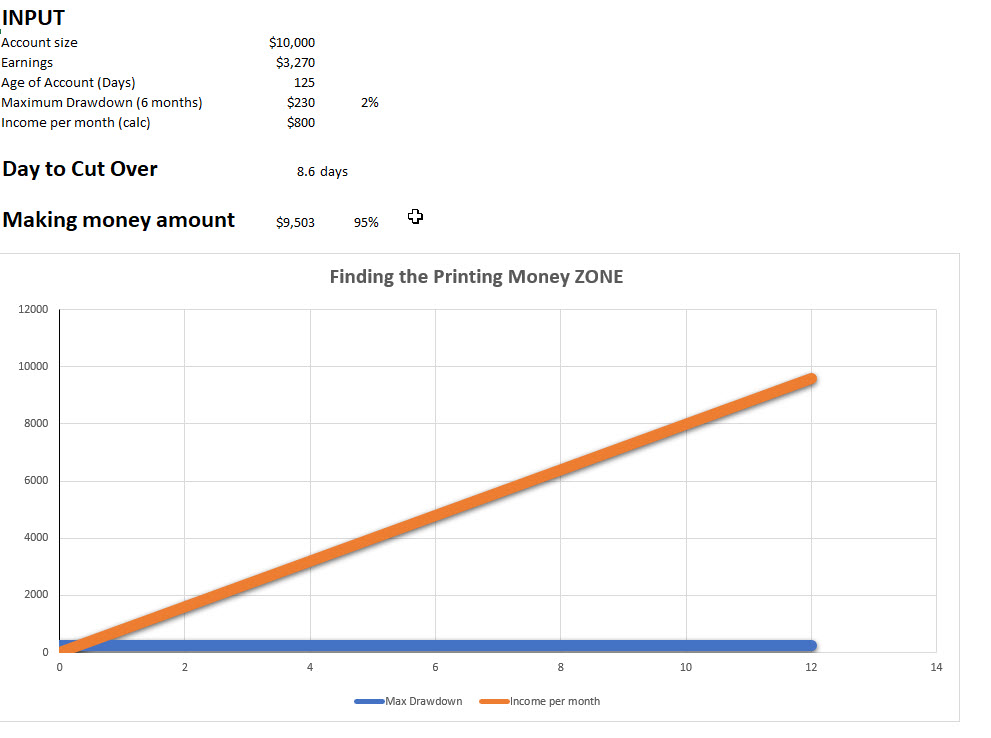
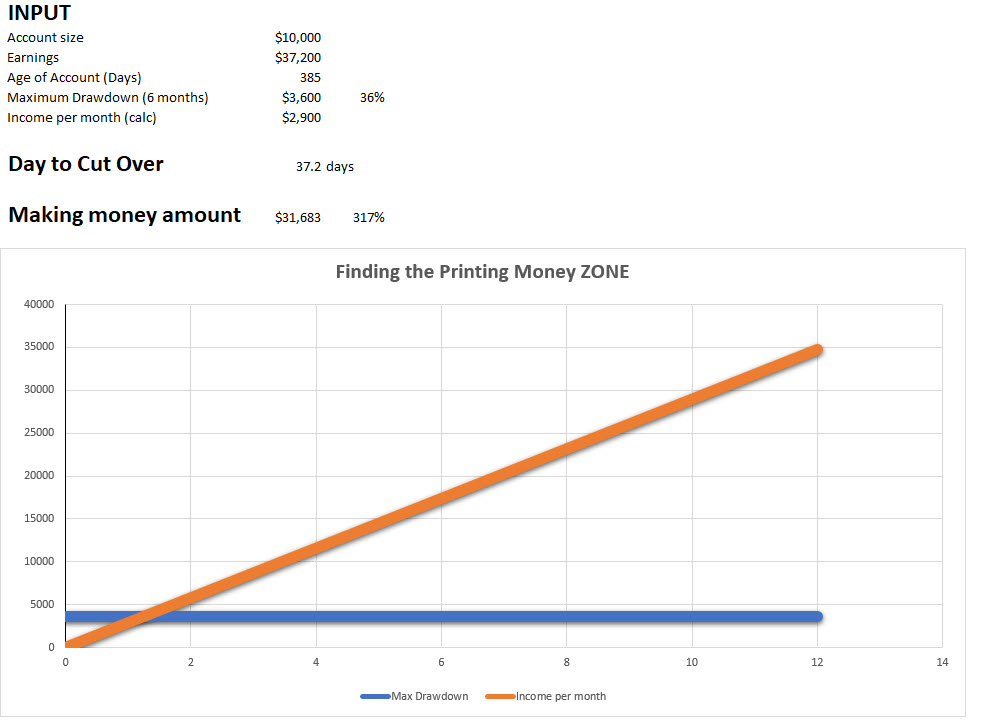
Let’s go and have a look at link12 one of the most popular links that there is . this link uses a ten thousand dollar account the earnings so far has been 37 000 dollars and it is an old account it’s already gone way over a year 385 days and the income per month is therefore just under three thousand dollars so this is generating three thousand dollars every month going up and that’s a proven one because it’s already run for over 12 months. the maximum drawdown if you look at that chart is 3600 so it will take 37 days to get to that crossover point where you have basically paid for your drawdown levels and you are then in the money making Zone and you can then trade on a low risk or no risk basis. that’s why this particular link12 is so popular I think it’s the most followed account in the linking service. let’s go have a look at another one just as the last view this is one that’s just been introduced it’s one of the new EAS that we have the wave Trader Linkwave1 and we go in there and we have a look at that that also uses ten thousand dollars the earning so far is three thousand dollars after a 125 days and the maximum drawdown so far has only been 230. so the income per month is actually 800 and you can see that the drawdown is paid for only after eight days and the potential income in this particular section for the year is nine thousand dollars which is 95% return on ten thousand dollars so again this is a new perspective you can see the drawdown’s extremely low it will most probably go up over time to about five percent or so but this is different kind of account that you can consider very low risk as it moves into the money making Zone because you have paid for your potential losses already and this becomes almost risk-free trading.
Okay, let’s focus on the strategies that we’ve identified. all our strategies are available in the linking service I had also just recently created a video where I show you how you can sneak in and copy the trays that are used in those strategies you can actually go and find the settings that those strategies use and therefore you’re in a position to either trade those strategies on your own EA or merely link to those particular accounts and enjoy those statistics. so if you haven’t watched this video already go and find out how you can copy the settings of a successful Trader not really copy work out the settings of a particularly successful Trader. the other place to find it is in our paid Forum you can see there are 50 linked accounts many of these accounts that I’ve shown you today are shown there they’re all. Some settings are available to our paid members of our Forum which helps them follow these linked accounts more closely. Also, we have the wave Liberator and the RSI Liberator, these are robots that have recently been launched and we are testing them and trading them and creating settings and those accounts that we are testing will be added to the linked account service and the settings from those will be available in the paid Forum https://www.forextradingsetups.com/linked-account-settings-923930 . I have shown you examples of the accounts that you can link to, go to the link to success page and see there are 70 other accounts that you can analyse as I’ve shown you now and what’s more you can download that Excel spreadsheet and the Excel spreadsheet is available on our free forum it’s a free download all you need to do is register for this forum if you haven’t done so already we have already over 10 000 members on this forum actively having downloaded items and participated in the forum but this is a free forum which is full of lots of stuff there’s free robots and indicators there’s free courses and books there’s trading success videos there are there’s General discussion forum where you can just talk to other Traders and then there are owners support forums over here and there are some specialist ones like optimization forums and so on so there’s a lot here for you. To find this look under indicator type of tool , look for recently posted , download the latest free Forex Trading tools here, and this is where this Excel spreadsheet can be found and we just click on it . You can also see they’ve been 22000 views of this Direction Finder tool that has 97 accuracy there are 48 000 views of the Candlestick pattern indicator. Really fantastic participation in this forum and people are downloading these free indicators there’s a 14 000 one the best scalper indicator and so on. Have a look through this free forum you’ll find the most fantastic things but the objective here was to download the Excel so just click on that link there and you’ll be able to download the excels tool that I show in the video now I hope you enjoyed this video and I hope you found it interesting and learned something new and also this is my personal approach to trading I’m not saying that it’s right; I know it’s right for me I’m not sure if it’s going to be right for you but I thought I’d show you what I do when trading the Forex market and you could most probably use these Concepts that I’m using to find the most effective accounts that you can either link to or copy; and that is where the money comes from but you also need to be aware that there is a danger zone you have to trade your way out of that danger zone and after that you get into a position where you’re at really low risk or no risk and you are “printing” money and no words to describe what happens when you are in that zone!!
Example 1
1000Link13
1000Link4
Link12
Linkwave1